
Everyone knows cycling is better for the planet than driving. But "better" isn't a number. Here's one: replacing car trips with a bike for a typical American commute, three or more days a week, can cut over 1,000 lbs (454 kg) of CO₂ per year. Here's how that math works, what the real carbon cost of cycling is, and why a folding bike changes the equation in ways a regular bike doesn't.
Bike vs Car: What the Carbon Numbers Actually Look Like
The Side-by-Side Comparison
According to the U.S. EPA, the average passenger vehicle emits about 400g of CO₂ per mile (249g/km) from the tailpipe. Upstream fuel production (refining and distributing gasoline) adds further emissions on top of that figure. A bicycle, including a folding bike, has a manufacturing carbon cost of around 5 to 8g of CO₂ per mile (3 to 5g/km) when that cost is spread across a typical lifespan. Food calories that power the ride add a modest amount on top, depending on diet.
The gap between driving and cycling is still large. Tailpipe emissions alone put the average car at roughly 50 times the per-mile manufacturing carbon cost of a bike. On a full lifecycle basis, accounting for fuel production, food, and manufacturing on both sides, the car is around 10 to 20 times more carbon-intensive per mile.
| Mode | CO₂ per mile (per km) | Annual CO₂: 10-mile (16 km) round trip, 5x/week |
|---|---|---|
| Average US car | ~400g (~249g) | ~2,293 lbs (1,040 kg) |
| Transit bus (national avg.) | ~180g (~112g) | ~1,032 lbs (468 kg) |
| E-bike (grid charged) | ~22g (~14g) | ~126 lbs (57 kg) |
| Bicycle / folding bike | ~5–8g (~3–5g) | ~29–46 lbs (13–21 kg) |
Urban rail (subway, light rail) typically emits 89 to 168g per passenger mile, depending on city and ridership, which is lower than bus at most US systems.
Sources: U.S. EPA passenger vehicle emission data; bicycle lifecycle manufacturing estimates.
What's Inside That 400g Per Mile
Most people think of car emissions as what comes out of the tailpipe. The EPA's figure of 400g per mile (249g/km) measures exactly that: direct tailpipe CO₂. Upstream emissions from refining and distributing fuel add further carbon cost on top of this number. Road infrastructure carries its own lifecycle emissions too, though those are spread across all users.
The 400g per mile is also a conservative estimate. It doesn't include manufacturing the car itself, which adds thousands of pounds of CO₂ spread across the vehicle's useful life. When you compare a car to a bike, the car side of the comparison is already an undercount.
Is Cycling Actually Zero Emission?
No, but it's remarkably close.
The Manufacturing Carbon Cost
Manufacturing a folding bike produces roughly 212 to 530 lbs (96 to 240 kg) of CO₂, depending on frame material, production methods, and supply chain. That's a real number, and it counts.
For comparison, manufacturing a passenger car produces an estimated 13,200 to 77,000 lbs (6,000 to 35,000 kg) of CO₂. The folding bike's production footprint is 40 to 230 times smaller.
Riding itself is human-powered. The only fuel input is food, and while food production carries carbon costs, the per-mile contribution is negligible compared to burning gasoline.
The Break-Even Point
A typical bicycle carries a manufacturing carbon debt of roughly 212 to 530 lbs (96 to 240 kg). Each mile ridden in place of a car saves approximately 0.88 lbs (~400g) of CO₂, net of the bike's manufacturing carbon cost spread across its lifespan.
The math: you break even at around 400 to 600 miles (640 to 960 km) of car-replacing rides.
For a regular commuter, that takes roughly two to four months. Past that point, every mile ridden is a net reduction.
Folding Bike – The Game Changer for Saving Carbon Cost
Manufacturing emissions are nearly identical for folding and standard bikes. Materials and weight are comparable. The carbon cost at the factory isn't the difference, usage frequency is.
Most people assume the environmental case for a folding bike comes from how it's made. The real case comes from how often it actually gets used. A folding bike stores indoors, beside your desk or in a closet, folds into a subway car, and fits in a car trunk. Because it goes where a regular bike can't, it gets ridden more often. A bike that gets ridden saves carbon. A bike sitting in storage doesn't.

How a Folding Bike Changes the Carbon Equation
Around half of Americans have access to a functioning bicycle. But fewer than 1% commute by bike, according to US Census data. That gap isn't mainly about willingness. It's about logistics.
The most common reasons people quit riding:
- No secure parking at the destination
- The bike can't board transit
- No place to store it mid-trip
A folding bike addresses all three at the individual level.
Total carbon savings equal the number of actual rides multiplied by the savings per ride. A folding bike raises the first number.
Why Foldability Is an Environmental Feature
Foldability is typically described as a convenience. From a carbon standpoint, it functions as a barrier remover. Every car trip replaced by cycling, whether the bike enters the office, boards the train, or fits in a back seat, is where the savings actually happen. The fold is what makes those trips possible.
The Multi-Modal Math
For commutes of 10 to 15 miles (16 to 24 km), full cycling may not be realistic every day. Combining a folding bike with transit covers most of the distance.
| Commute Scenario | Daily CO₂ | Annual CO₂ (250 workdays) |
|---|---|---|
| Drive full 15 miles (24 km) | ~6,000g | ~3,307 lbs (1,500 kg) |
| Subway only* | ~1,335g | ~736 lbs (334 kg) |
| Folding bike 3 mi (5 km) + subway 12 mi (19 km)† | ~1,088g | ~599 lbs (272 kg) |
| Folding bike full 15 miles (24 km) | ~98g | ~54 lbs (25 kg) |
*Transit figures based on efficient urban rail at ~89g/passenger mile. Actual figures vary by city and route.
The folding bike and subway combination cuts annual emissions to about 18% of driving the full distance. For most people with transit access, that's achievable starting now.
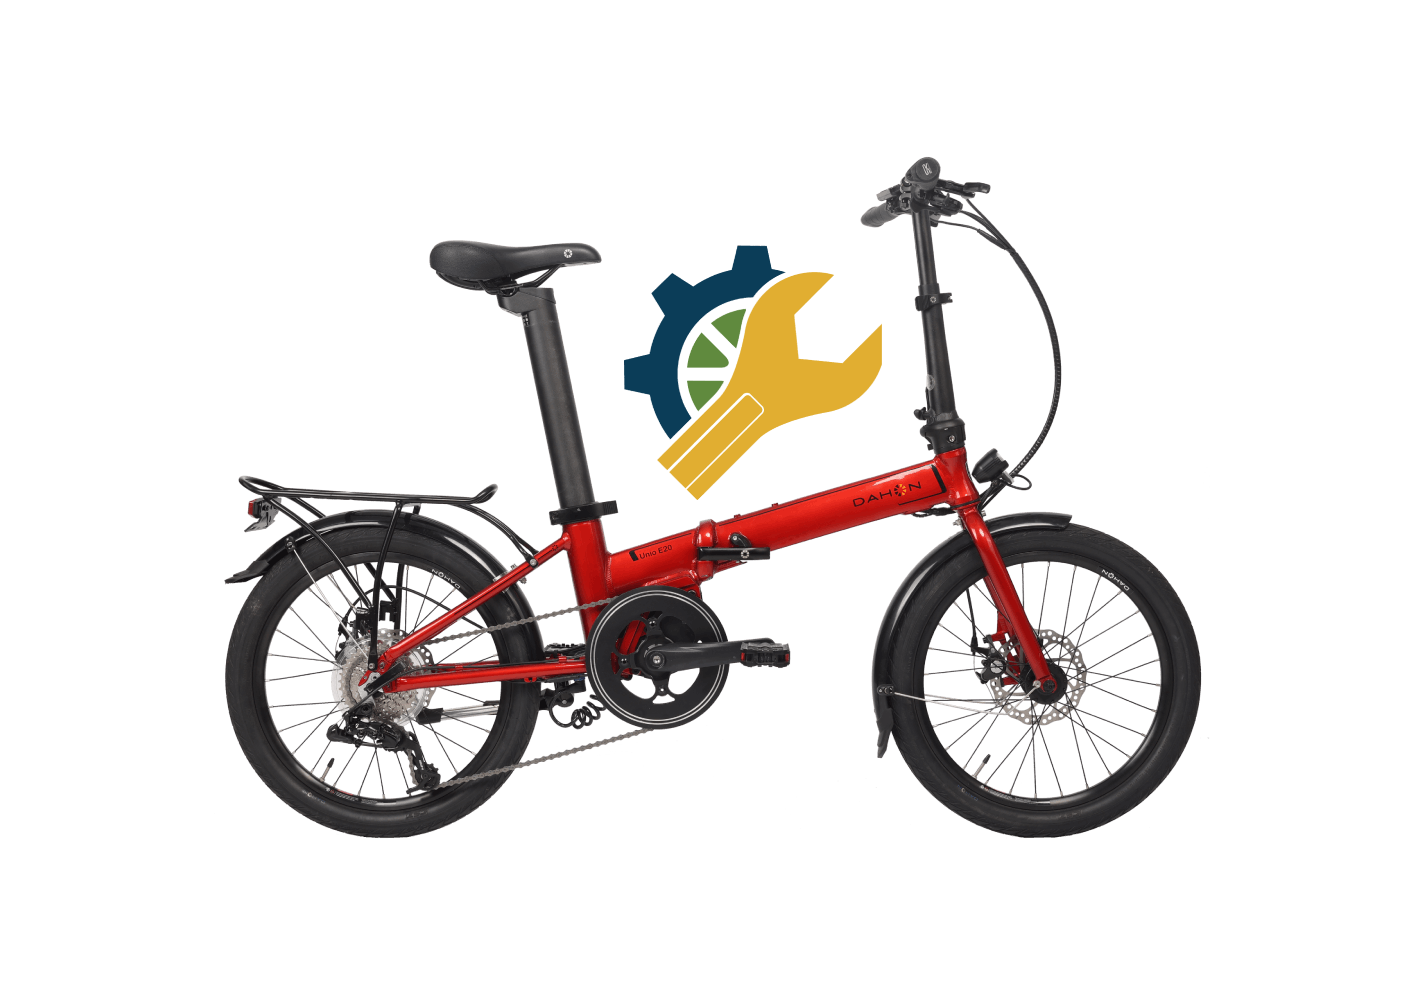
DAHON has been building folding bikes for urban commuters for over 40 years. See the full lineup at usa.dahon.com.
Replace Your Shortest Car Trips First
Short car trips carry the highest per-mile emissions. During a cold engine start, a car emits two to three times more CO₂ per mile (per km) than it does once the engine is warm. Trips under 3 miles (5 km) are where that cost peaks.
These are also the trips a folding bike handles best. For a pharmacy run or grocery pickup within 3 miles (5 km), cycling door-to-door often takes the same time as driving and finding a spot. The bike comes inside with you. No rack, no lock, no theft exposure.
A good first step: use a navigation app to mark destinations within 3 miles (5 km) of home, pick one next week, and ride instead of drive. Not for the environment, but because it's faster.
Build a Multi-Modal Commute Routine
If your workplace is 10 to 15 miles (16 to 24 km) away with transit running in between, the folding bike handles the first and last legs. Ride 2 to 3 miles (3 to 5 km) to the station, fold and board, unfold and ride to the office. It can be stored in the aisle space, overhead area, or end-car section on most transit systems.
On rough weather days, shorten the cycling legs. The transit portion stays constant. The system holds up even when full cycling doesn't.
| Commute Mode | Annual Reduction vs. Car | Annual CO₂ Saved |
|---|---|---|
| Subway replacing car | ~78% | ~2,571 lbs (1,166 kg) |
| Folding bike + subway | ~82% | ~2,708 lbs (1,228 kg) |
| Folding bike full route | ~98% | ~3,253 lbs (1,476 kg) |
Take It Beyond the Commute
Americans average around 30 miles (48 km) of weekend driving per day. Many of those trips fall within cycling range. Replacing half of weekend car use adds roughly 300 to 400 lbs (136 to 181 kg) of annual CO₂ savings on top of commuting gains.
The bike also fits in a car trunk. Drive to a trailhead or park, unpack it, ride from there. Parking in most US cities costs $15 to $30 per visit. Every errand the bike covers removes that cost entirely.
A simple shift that works for many people: use the folding bike as the default for weekend trips within range, and only take the car when the distance actually requires it.
Make Bad-Weather Days Work
Weather is the most cited reason people stop cycling. A folding bike changes the calculus. On a rainy day: ride to the nearest covered station, fold, board transit, and finish the last stretch by bike. Most of the trip stays dry, the bike comes inside with you, and the savings still happen even with a shorter riding segment.
Riders who stick to sunny days typically get around 60 days of riding per year. A multi-modal approach extends that to 180 or more, with no full cycling required on every trip. That threefold increase in riding days triples your annual CO₂ reduction with no other change.
Track Your Numbers
Carbon savings are invisible without a record. Note the mileage of each car trip you replaced. Multiply by 0.88 lbs (~400g) per mile. Total it monthly.
Tracking also captures cash saved. At $20 per round trip in parking and fuel, three weekly substitutions add up to around $3,000 per year. Both numbers come from the same rides.
| Track | Method | Monthly Target |
|---|---|---|
| Rides replaced | Phone notes or cycling app | 10–15 |
| CO₂ saved | Rides × miles × 0.88 lbs/mile (0.25 kg/km) | 40–80 lbs (18–36 kg) |
| Money saved | Rides × (parking + fuel cost) | $80–150 |
How to Calculate Your Own Annual CO₂ Savings
The numbers above are based on typical scenarios. Here's how to calculate yours.
A Simple Three-Step Framework
Step 1: Measure your current car use
Single trip distance (miles) × 2 × weekly trips × 52 weeks × 400g = annual CO₂ in grams
Example: 10 miles (16 km) × 2 × 5 days × 52 weeks × 400g = 2,080,000g = about 4,585 lbs (2,080 kg) per year
Step 2: Choose a replacement frequency
Starting with three or more days per week produces real results. Apply the same formula with the lower trip count to see your adjusted annual savings.
Step 3: Convert to something concrete
| Annual Savings | Equivalent To |
|---|---|
| 500 lbs (227 kg) CO₂ | Skipping one flight from NYC to LA |
| 1,000 lbs (454 kg) CO₂ | Planting around 21 trees |
| 1,500 lbs (680 kg) CO₂ | Not eating beef for a full year |
| 2,000 lbs (907 kg) CO₂ | Powering a home for two months |
The Single-Habit Swap
In practice, replacing one routine at a time tends to produce more durable results than changing everything at once. Find the car trip you make most frequently that falls within 5 miles (8 km) of home. Replace it by bike for two weeks and let that change stabilize first.
When Full Replacement Isn't the Goal
Three substitutions per week already add up to ~920 to 1,375 lbs (418 to 624 kg) of annual CO₂ reduction, depending on your trip distance. Consistent partial replacement delivers greater real-world savings than a complete overhaul plan that never gets started.

Ride Further, Save More
Cycling produces a fraction of the carbon that driving does, and a folding bike removes the practical barriers that stop most people from actually riding. Going car-free isn't a requirement to make a real difference. Replacing three or more car trips per week adds up to over 1,000 lbs (454 kg) of CO₂ saved each year. This Earth Day, that's a concrete place to begin. Browse DAHON's full folding bike lineup at usa.dahon.com.
Frequently Asked Questions
Q1: How much CO₂ does a folding bike save per year?
It depends on how often you ride and how far. A typical scenario: 10-mile (16 km) round trips, three days per week, saves around ~1,375 lbs (624 kg) annually. Full commute replacement for that same distance can push the figure above 2,000 lbs (907 kg).
Q2: Is cycling really zero emission?
No, but it's close. Manufacturing a bike produces roughly 212 to 530 lbs (96 to 240 kg) of CO₂. Riding 400 to 600 miles (640 to 960 km) in place of car trips offsets that manufacturing cost entirely. Every mile ridden past that point is a net reduction.
Q3: Is a folding bike more eco-friendly than a regular bike?
Manufacturing emissions are nearly the same. The difference is in actual usage. A folding bike removes the logistics barriers that cause most people to quit riding, so it gets used more often. Higher usage is what drives higher cumulative carbon savings over time.
Q4: How does cycling compare to taking the bus or subway?
Transit bus averages around ~180g of CO₂ per passenger mile (112g/km) at typical US occupancy. Urban rail runs lower, typically 89 to 168g per passenger mile, depending on the system. A bicycle's manufacturing carbon cost, spread across a typical lifespan, comes to just 5 to 8g per mile (3 to 5g/km). Pairing a folding bike with rail transit produces far lower combined emissions than bus or car travel alone, and keeps the flexibility of door-to-door cycling for the first and last mile.
Q5: How many car trips do I need to replace to make a noticeable difference?
Three per week is enough to matter. At 10 miles (16 km) round trip, three weekly replacements reduce annual emissions by around ~1,375 lbs (624 kg), roughly equal to planting about 29 trees or skipping two cross-country flights.


Share:
Comfortable Bike for Seniors Over 60: Guide for Easy Riding
The Complete Guide to Folding Bike Accessories: Racks, Bags, and Essential Add-Ons